AI Property Analyzer
From hours of manual research to a single clear decision
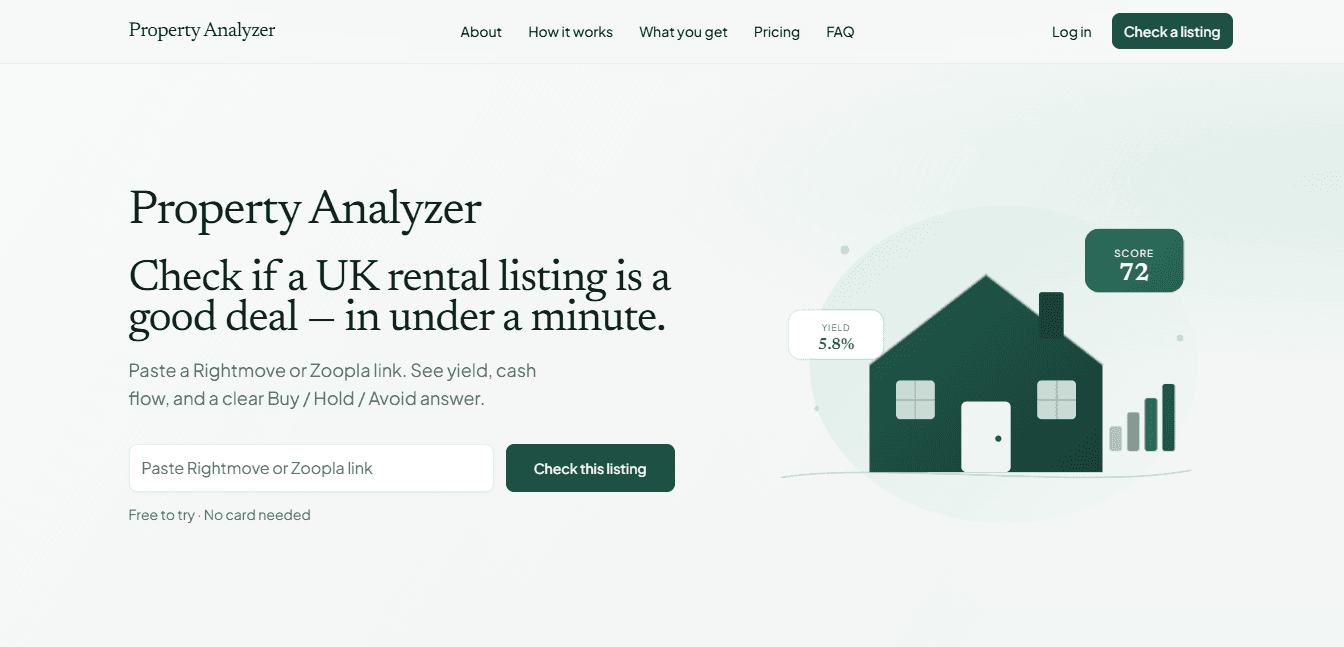
How I built a full-stack SaaS that turns a UK property listing into a single buy, hold, or avoid decision, backed by 15+ verified data sources.
- Role
- Sole developer across product, data pipeline, backend, frontend and deployment
The problem
A Rightmove or Zoopla listing shows photos and an asking price. It doesn't tell a buy-to-let investor whether the investment actually works.
So investors do it by hand: open the listing, then cross-check a dozen scattered sources such as sold prices, EPC ratings, crime data, rental comparables and planning history, before they can judge whether a property is even worth a viewing. That's hours of work per property, repeated across every shortlist.
The cost isn't only time. Because the research is manual, it's inconsistent: two properties rarely get compared on the same basis, and the numbers behind a decision are hard to re-check later.
What I built
A full-stack SaaS built around a single input: paste a listing link, get a decision. Behind that one field, the system pulls and normalizes 15+ verified UK data sources into one comparable view, then returns a buy, hold, or avoid signal with the yield calculations that produced it.
I built the product end to end: the data pipeline, the analysis layer, the billing system, the interface, and the deployment.
- A data pipeline in PostgreSQL that ingests and normalizes 15+ sources into a consistent schema
- An LLM analysis layer that turns the normalized data into a single buy, hold, or avoid signal
- Yield calculations exposed alongside the signal, so the recommendation can be audited
- Stripe billing and subscriptions, built in from the start rather than bolted on later
- Deployment and infrastructure on AWS
Why the data layer was the hard part
The interface is one input and one answer. Almost all of the engineering sits underneath it.
Fifteen-plus sources means fifteen-plus different shapes of data, with different identifiers, formats, update frequencies, and gaps. Making them comparable is the actual product: a signal is only as trustworthy as the normalization that feeds it, so the pipeline had to reconcile them into one schema before any analysis could run.
That's also why every underlying data point stays traceable rather than being collapsed into a score. An investor putting money into a property needs to check the reasoning, not just trust a number, so the answer is designed to be opened up and verified.
The result
Research that took an afternoon now takes seconds, and every property gets assessed on the same basis instead of whatever the investor had time to check that day.
Because the data behind each signal stays visible, the output can be checked rather than simply trusted, which is what makes it usable for an actual buying decision.
Stack
Have a similar problem?
If this sounds like what you are dealing with, let's talk it through.